IPO underwriter’s conflict of interest: When IPO underwriter has stake of the issuer
IPO underwriter’s conflict of interest: When IPO underwriter has stake of the issuer
Link to my latest version of paper
We study whether IPO over pricing exits in the case where the underwriter has a share of the issuer before the offering. Recent surge of private capital implies the run away from heavily regulated public assets and alarms the importance of studying private equity and venture capital. Gompers and Lerner (1999) argues that IPO underwriting by investment banks that hold equity in a firm through a venture capital subsidiary show no overpricing activities and opposes regulating underwriter venture capital investment. However, Gompers and Lerner (1999) did not consider the IPO lock up period. In this paper, we consider the 180 day lock up period and will verify whether the long term return changes before and after the 180 day threshold. We find that IPOs in which underwriters hold prior venture investments are overpriced and perform worse by about 9.2% to 10.2% than offerings in which no underwriter has a venture stake. Beyond regression analysis, this paper uses a difference-in-differences model by using affiliation of IPO as treatment and the 180 day period as the intervention date and reports that there exits about 2.5% over pricing in affiliated IPOs. Though both analysis show insignificant statistics at this moment, we are currently working on several methods to verify the results.
(Disclaimer: This is a very exaggerated argument at this moment. This paper is on progress and currently working on several methods to verify the results.)
Regression Analysis
Our regression model is

For dependent variables $Y$, we iteratively use excess initial return, excess 1 week return, excess 1 month return, excess 3 month return, excess 6 month return, excess 1 year return.The excess return is the difference between the buy-and-hold return of the issuing firm and the buy-and-hold return of the portfolio(weighted average return) of firms within the same industry and period. As independent variables of interest, $UnderwriterAffiliation$ is 1 if underwriter has pre-IPO affiliation with issuer. We have 2 cases where any underwriter has pre-IPO affiliation with issuer or lead underwriter has pre-IPO affiliation with issuer.
For control variables $X$, we include natural logarithm firm size, floating shares ratio, and underwriter fixed effects. The firm size control variable is included to alleviate the concern that firm size may introduce some mechanical correlation between the stock return and the UnderwriterAffiliation measure. The floating shares ratio variable is introduced because the supply of the shares might effect the price of the IPO. There is a concern about the endogeneity of the floating shares ratio variable but after assuming no correlation between affiliation we decide to include floating shares ratio variable in our equation. I included underwriter fixed effects to account the effect of specific underwriters.
Moreover, in all of our regression analyses for excess returns, we excluded year and industry fixed effects because the excess return is a demeaned variable of returns by year and industry. However, in our regression analyses for normal returns (Table 6.) we included year and industry fixed effects to account for unobserved factors at the year level and the industry level. So all the results are estimated exploring cross-sectional variations across firms in the same point of time and industry respectively.
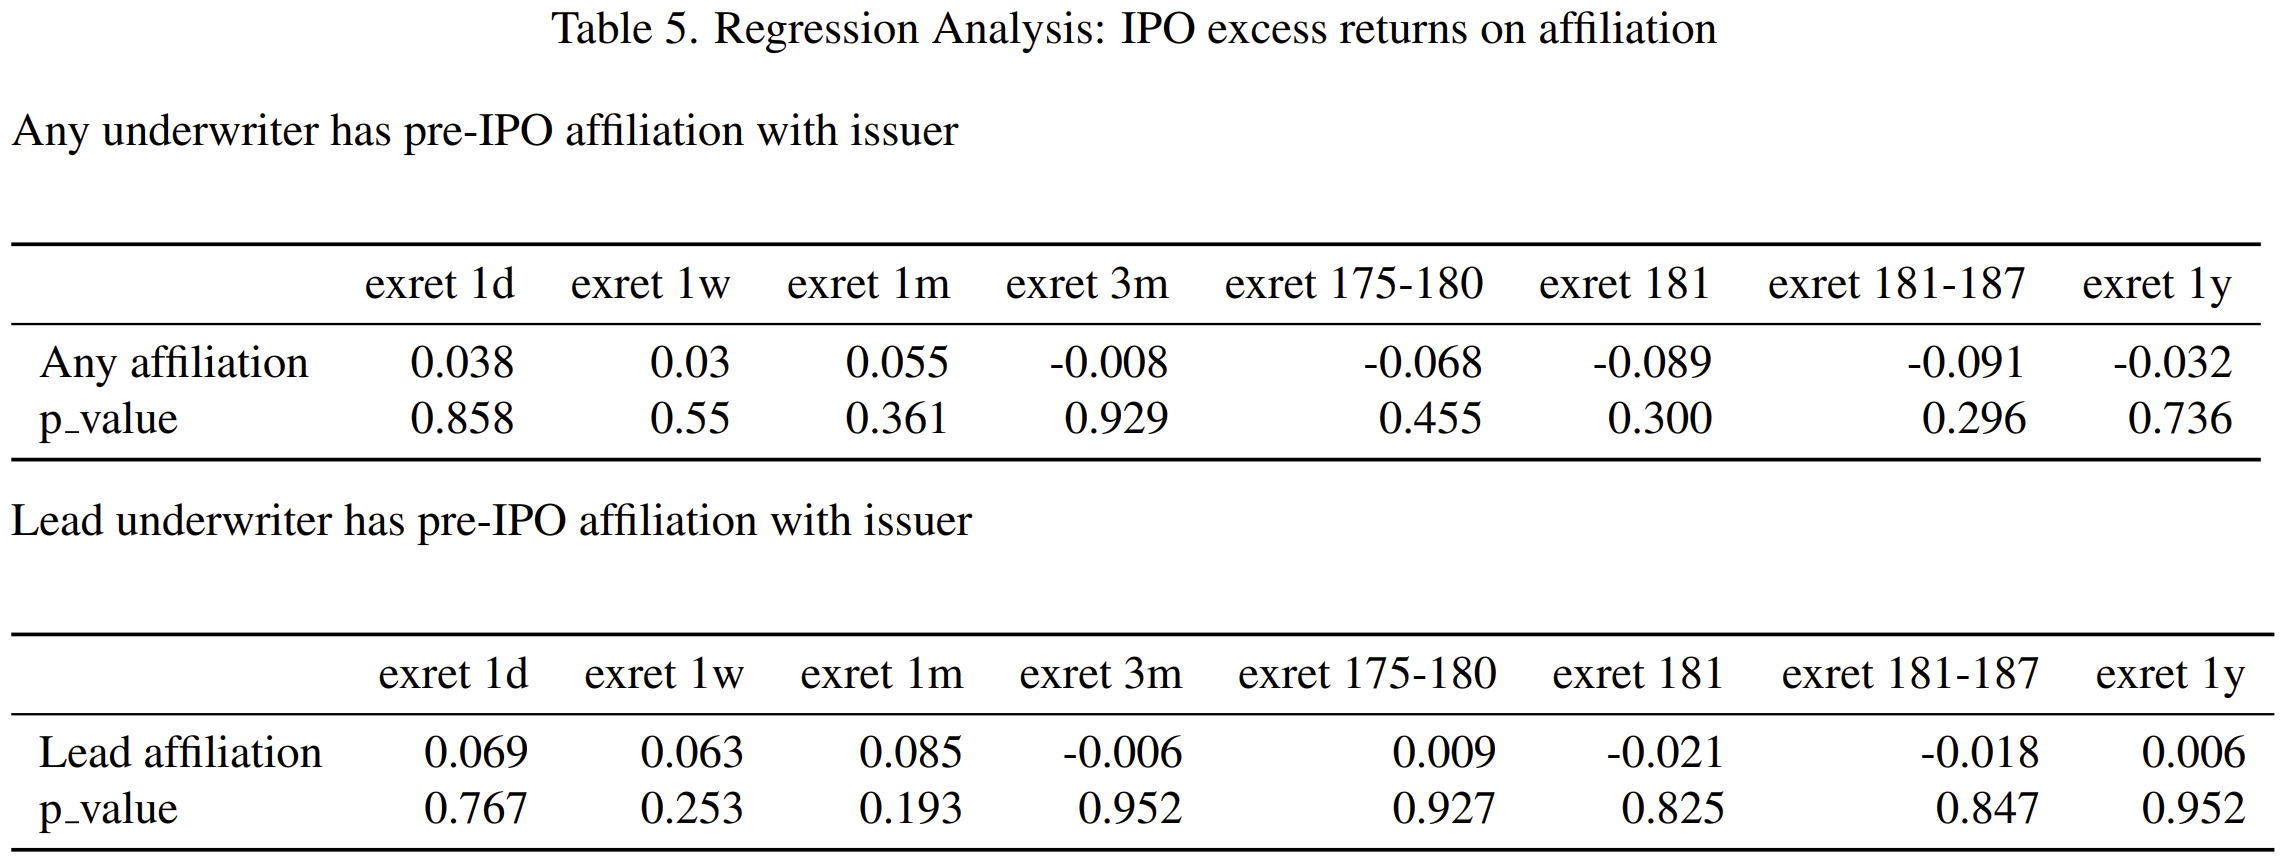 The first day Initial IPO performance is the percentage change from the offering price to the closing price on the first day of trading. All Long term
performance is the buy-and-hold return. The excess return is the difference between the buy-and-hold return of the issuing firm and the buy-and-hold
return of the portfolio of firms within the same industry. Variables ex ret 175 180 and ex ret 181 187 are the average returns in the given period. All of
the returns are winsorized in the 1% level.
The first day Initial IPO performance is the percentage change from the offering price to the closing price on the first day of trading. All Long term
performance is the buy-and-hold return. The excess return is the difference between the buy-and-hold return of the issuing firm and the buy-and-hold
return of the portfolio of firms within the same industry. Variables ex ret 175 180 and ex ret 181 187 are the average returns in the given period. All of
the returns are winsorized in the 1% level.
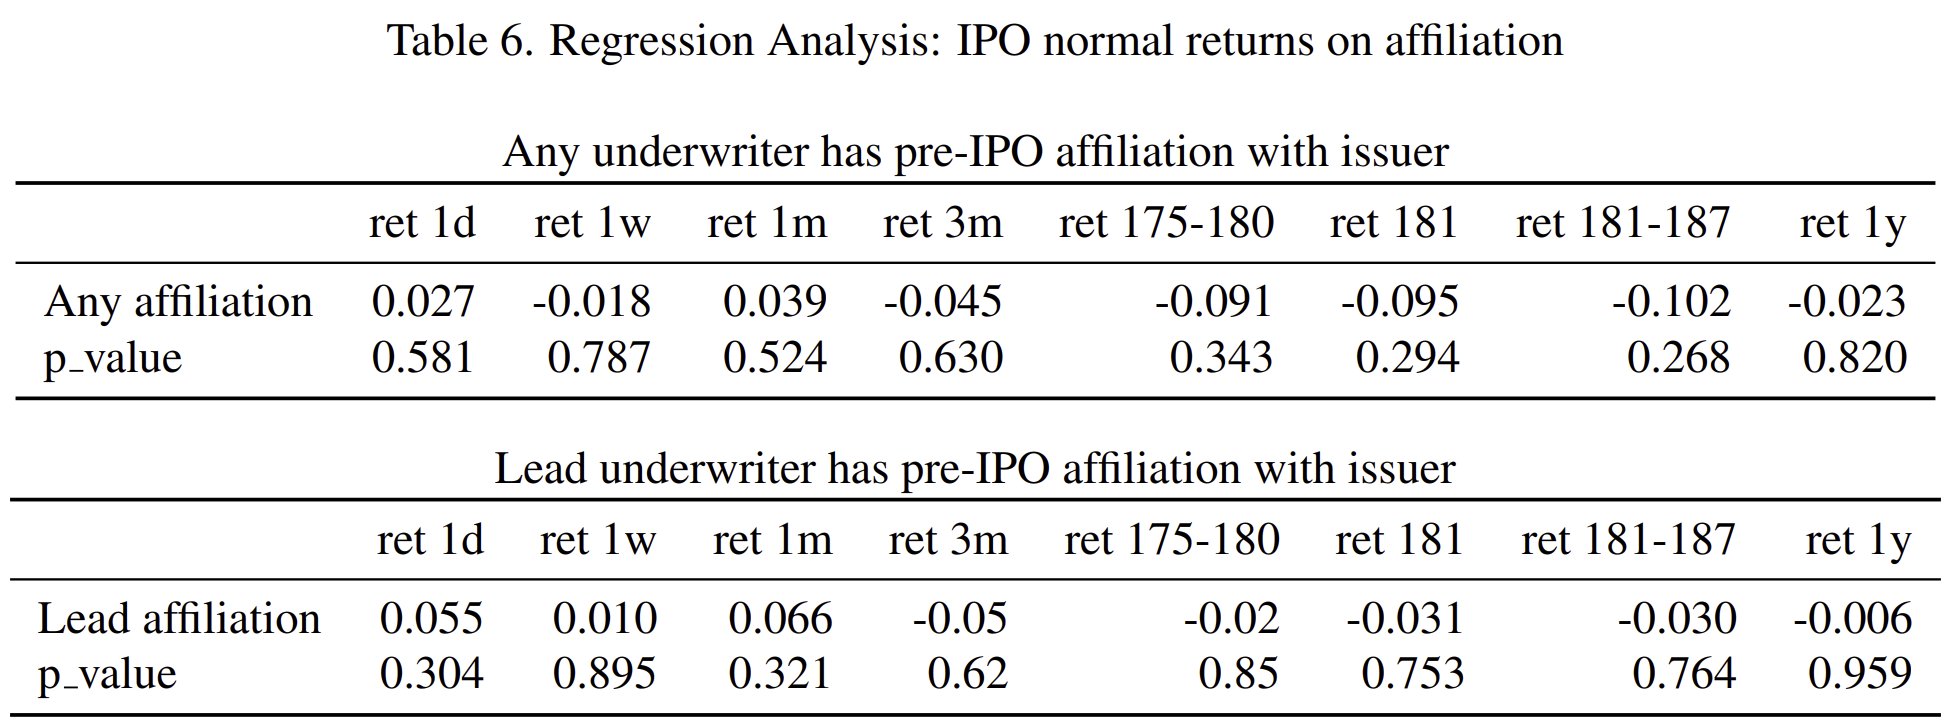 The first day Initial IPO performance is the percentage change from the offering price to the closing price on the first day of trading.
All Long term performance is the buy-and-hold return. Variables ret 175 180 and ret 181 187 are the average returns in the given period. All of the returns are winsorized
in the 1% level.
The first day Initial IPO performance is the percentage change from the offering price to the closing price on the first day of trading.
All Long term performance is the buy-and-hold return. Variables ret 175 180 and ret 181 187 are the average returns in the given period. All of the returns are winsorized
in the 1% level.
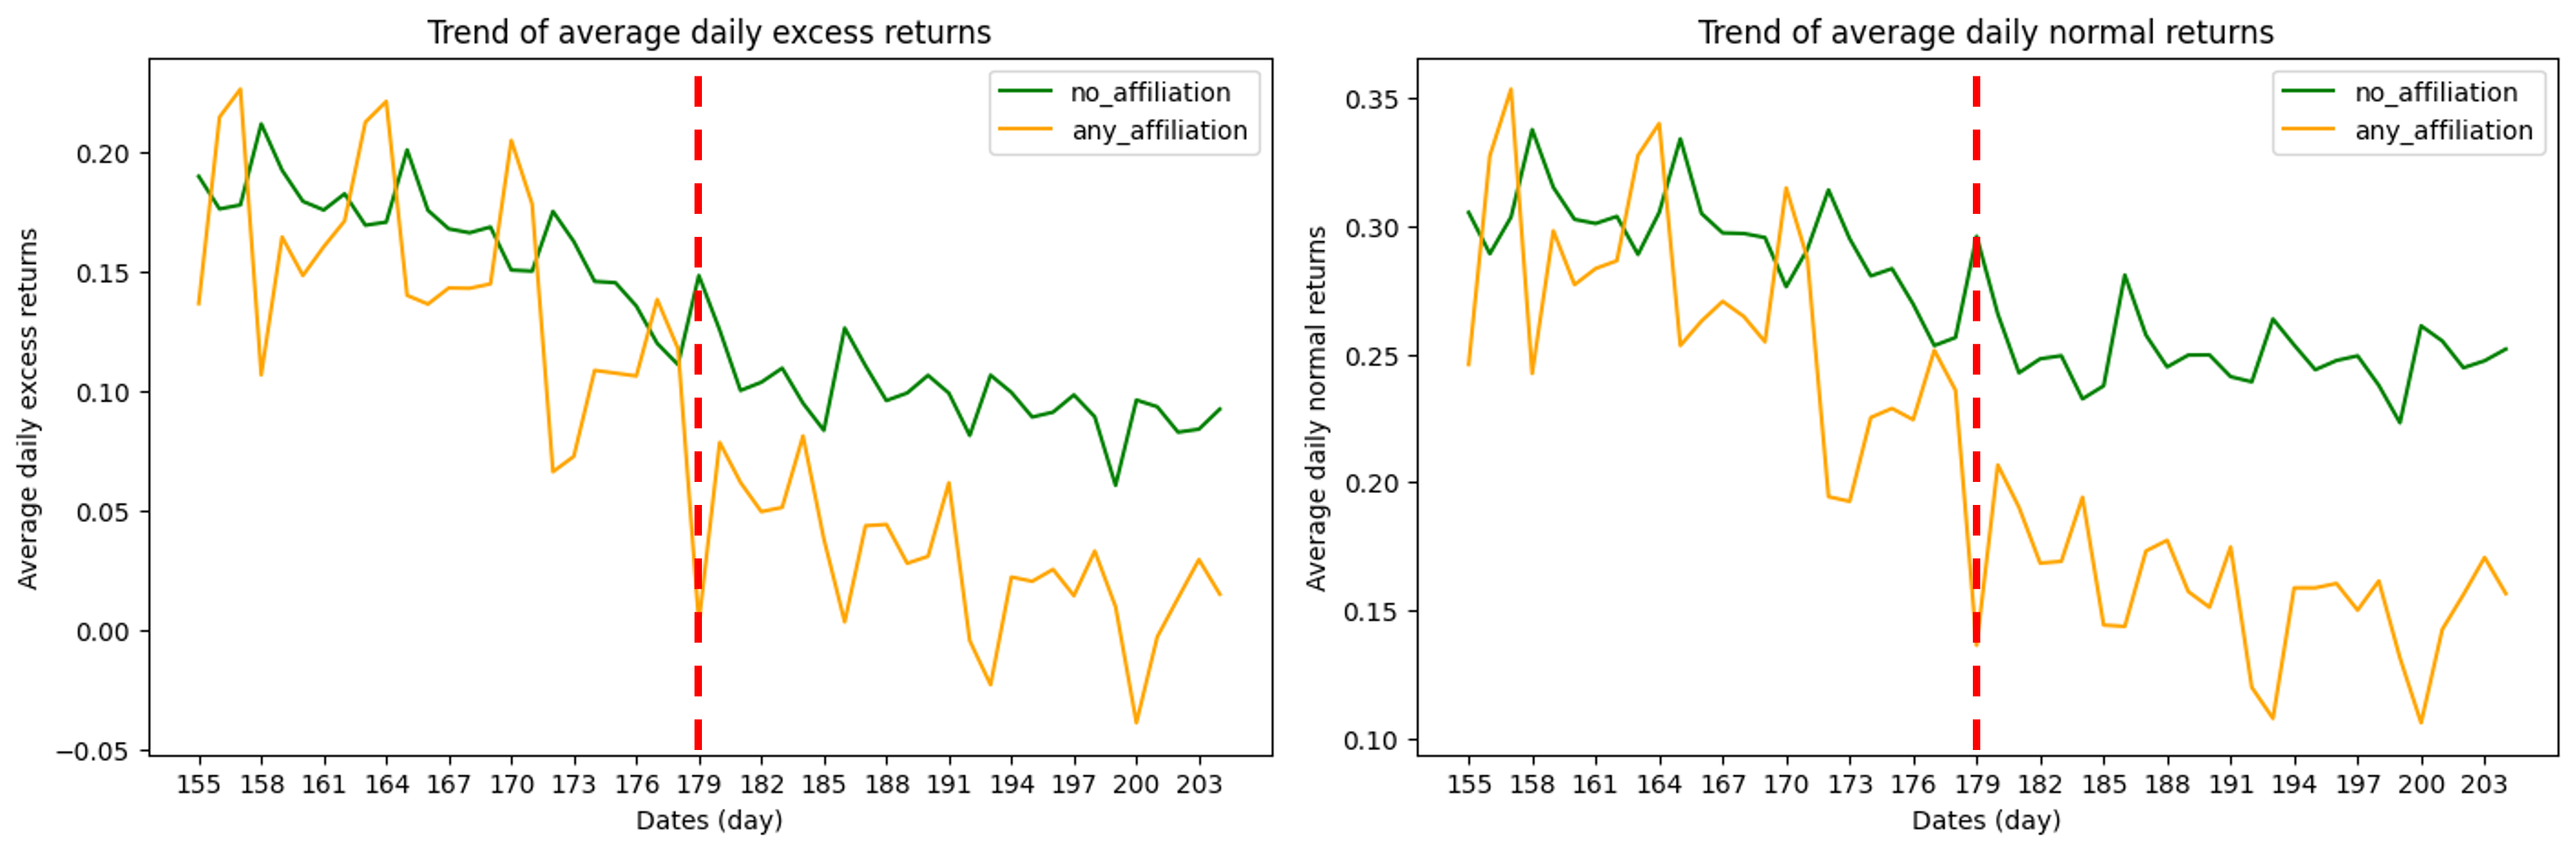
The returns near the 180 day period have a drastic decrease when underwriter affiliation exits. Therefore this paper argues that when underwriter affiliation exits, an IPO overpricing happens in terms of the 6 months return. The typical lock-up periods for institutional investors is 180 days. For the cases where any underwriter had shares of the issuer before the IPO, we argue that the offering shares was overpriced by about 9.1% to 10.2%. Once we consider this 6 month lock-up period, we can find some evidence of these pump and dump schemes overpricing its IPO deal.
We could also detect the difference between before 180 day average return and after 180 day average return. If we use the 180 day lock-up period as the threshold, we could conduct a difference in difference model to show the real over-pricing of affiliated IPOs. In the next section we will implement difference in difference model using the affiliation as treatment and the 180 day threshold as the intervention period.
Difference in Difference Analysis
Let’s check the pre and post intervention trend.
Our difference in difference model is

For dependent variables Y, we use returns before 180 day intervention period and after 180 day intervention period. For data where returns before 180 day intervention period are assigned as dependent variable, the after 180 variable is 0. On the other hand, for data where returns after 180 day intervention period are assigned as dependent variable, the after 180 variable is 1. The coefficient of the interaction term shows the true decrease in long term return due to the affiliation treatment.
For control variables X, we include natural logarithm firm size and floating shares ratio. The firm size control variable is included to alleviate the concern that firm size may introduce some mechanical correlation between the stock return and the UnderwriterAffiliation measure. The floating shares ratio variable is introduced because the supply of the shares might effect the price of the IPO. There is a concern about the endogeneity of the floating shares ratio variable but after assuming no correlation between affiliation we decide to include floating shares ratio variable in our equation.
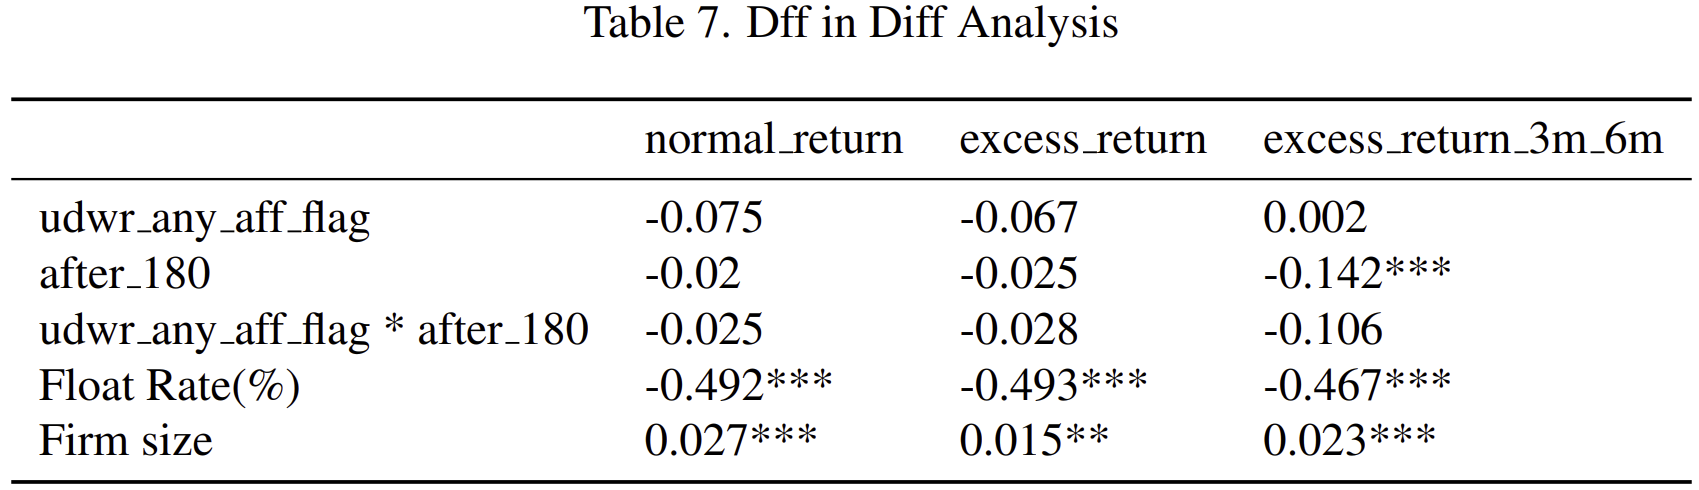 For normal return and excess return variables, we differenced the average returns of the 175 to 180 day window and average returns of the 181 to 187
day window. For the excess return 3m 6m variable, we differenced the 3m return and the 180 day return. Firm size variable is winsorized in the 1%
level. ***, **, * denote statistical significance at the 1%, 5% and 10% levels, respectively.
For normal return and excess return variables, we differenced the average returns of the 175 to 180 day window and average returns of the 181 to 187
day window. For the excess return 3m 6m variable, we differenced the 3m return and the 180 day return. Firm size variable is winsorized in the 1%
level. ***, **, * denote statistical significance at the 1%, 5% and 10% levels, respectively.
The effect of the affiliation treatment did not show significant effect on the return in the given time frame. We assume this insignificant result is caused by the market’s acknowledgment of the upcoming expiration of the lock-up period. In Table 7, we additionally reported the diff in diff results differencing 3 month return and 180 day return. The results were still insignificant, but the gap had increased between affiliated IPO cases and not affiliated IPO cases. Rather than focusing of the narrow time frame, differencing a wider time window might help the analysis in the future.
Further Research
After the difference in difference analysis, the 180 days period still seems very interesting. Besides comparing the buy-and-hold returns right before and after the 180 day Lock-Up period, comparing given a wider time frame also might be promising. If investors already acknowledge the expiration of the lock-up period, it might be better to difference, for example, 130 day return and 180 day return. Additionally, I would qualitatively check the S-1 reports to see rather the underwriters had really sold there shares right after the 180 day lock-up period. I am expecting to get more significant statistics and gain more evidence towards my argument after this approach.