Mutual Fund’s R2 as Predictor of Performance
Mutual Fund’s R2 as Predictor of Performance
Yakov Amihud, Ruslan Goyenko
Yakov Amihud and Ruslan Goyenko proposed that fund performance can be predicted by its R2, obtained from a regression of its returns on a multifactor benchmark model. Lower R2 indicates greater selectivity, and it significantly predicts better performance. Stock funds sorted into lowest-quintile lagged R2 and highest-quintile lagged alpha produce significant annual alpha of 3.8%. Across funds, R2 is positively associated with fund size and negatively associated with its expenses and manager’s tenure. (JEL G20, G11, G20, G23)
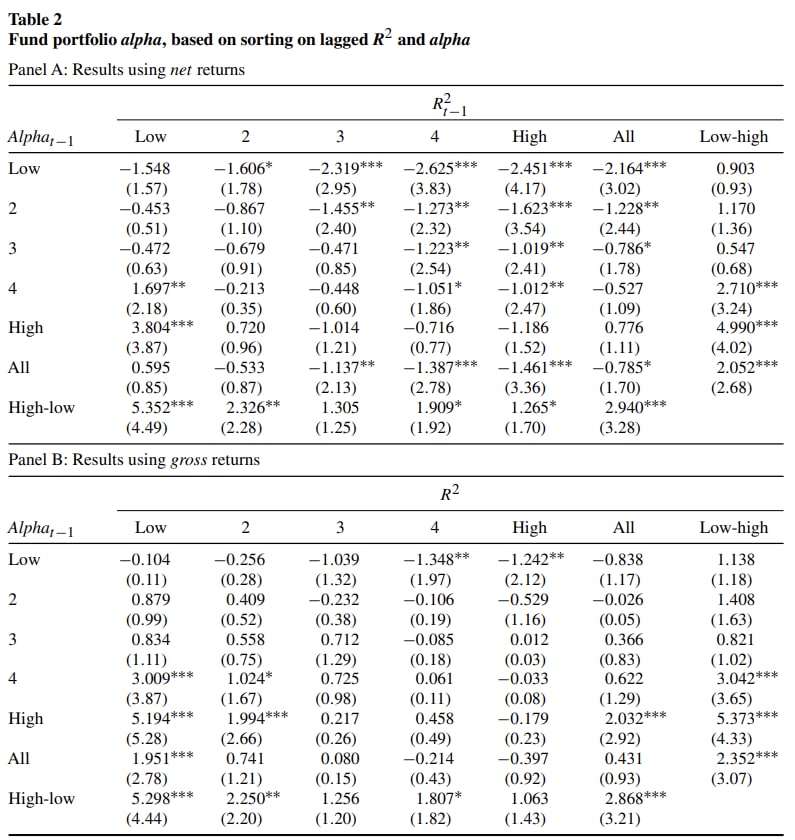
The table presents the portfolio alpha, annualized, using monthly returns. Portfolios are formed by sorting all funds every month into quintiles by R2 and then by alpha. Both are obtained for the twenty-four-month estimation period (t −1) by regressing each fund’s monthly excess returns (over the T-bill rate) on the factors returns, using the FFC (Fama and French 1993 and Carhart 1997) factor model. Then for the following month test period (t), we calculate the monthly average excess returns for each portfolio of funds. The process repeats by moving the estimation and test period one month at a time. The test period average portfolio returns are regressed on the returns of the FFC model. For each portfolio (cell) we present alpha, the intercept from the above regression and its t-statistic, using robust standard errors (White 1980). The sample period of the test months is from 1/1990 to 12/2010 (252 months). ∗∗∗, ∗∗, and ∗ denote significance at the 1%, 5%, or 10% level.